Install
macOS 14 or later · Apple silicon and Intel.
- Download
CommonStats.zip, unzip it, and move Common Stats to Applications. Or open the disk image and drag it there. - Open it. The first time, macOS says it can't verify the developer: the build is signed but not notarized. Open System Settings › Privacy & Security, scroll down, and click Open Anyway next to
Common Stats. Or clear the flag from a terminal:
xattr -dr com.apple.quarantine "/Applications/Common Stats.app" - Pick what the menu bar shows in Settings, and turn on Open at login.
From a terminal
Both install the same build and clear the quarantine flag, so there is no Open Anyway step.
brew install --cask oddurs/common-tools/common-statsHomebrew keeps it current with brew upgrade. The cask is in oddurs/homebrew-common-tools.
curl -fsSL https://oddurs.github.io/common-tools/install.sh | sh -s -- statsThe script downloads the latest release, checks it against the published checksum, installs it in Applications in place of an older copy, and opens it. Name several apps to install them all, or run it with no name to list them. It's short enough to read first.
Every release, with checksums and notes, is on GitHub. To check a download: shasum -a 256 -c CommonStats.zip.sha256.
Upgrading from a copy with the app's earlier name? Common Stats quits it when it first opens and keeps your settings; move the old app from Applications to the Trash. If Open at login stops working, turn it off and on again.
The menu bar item
Common Stats draws CPU, GPU, memory, network, disk activity, storage, and battery in one menu bar item, in the order you choose. The bar is a template image, so macOS tints it for light and dark menu bars, dims it on inactive displays, and adjusts it for Increase Contrast, like the clock.
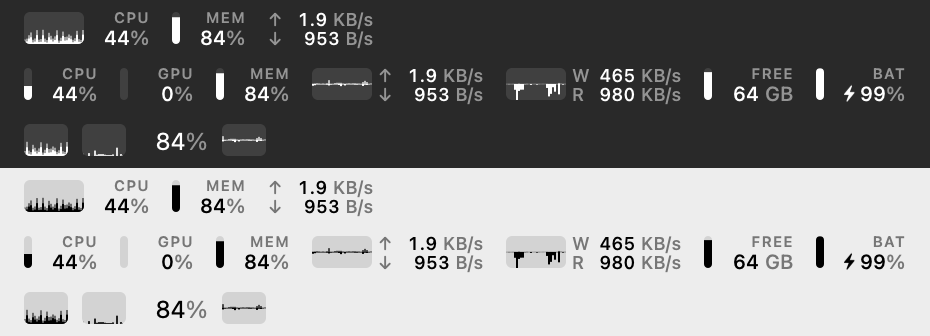
VoiceOver reads it as a sentence: "CPU 21%, Memory 82%, Network down 6.1 KB/s, up 1.0 KB/s".
The menu
Click the item for a menu of cards:
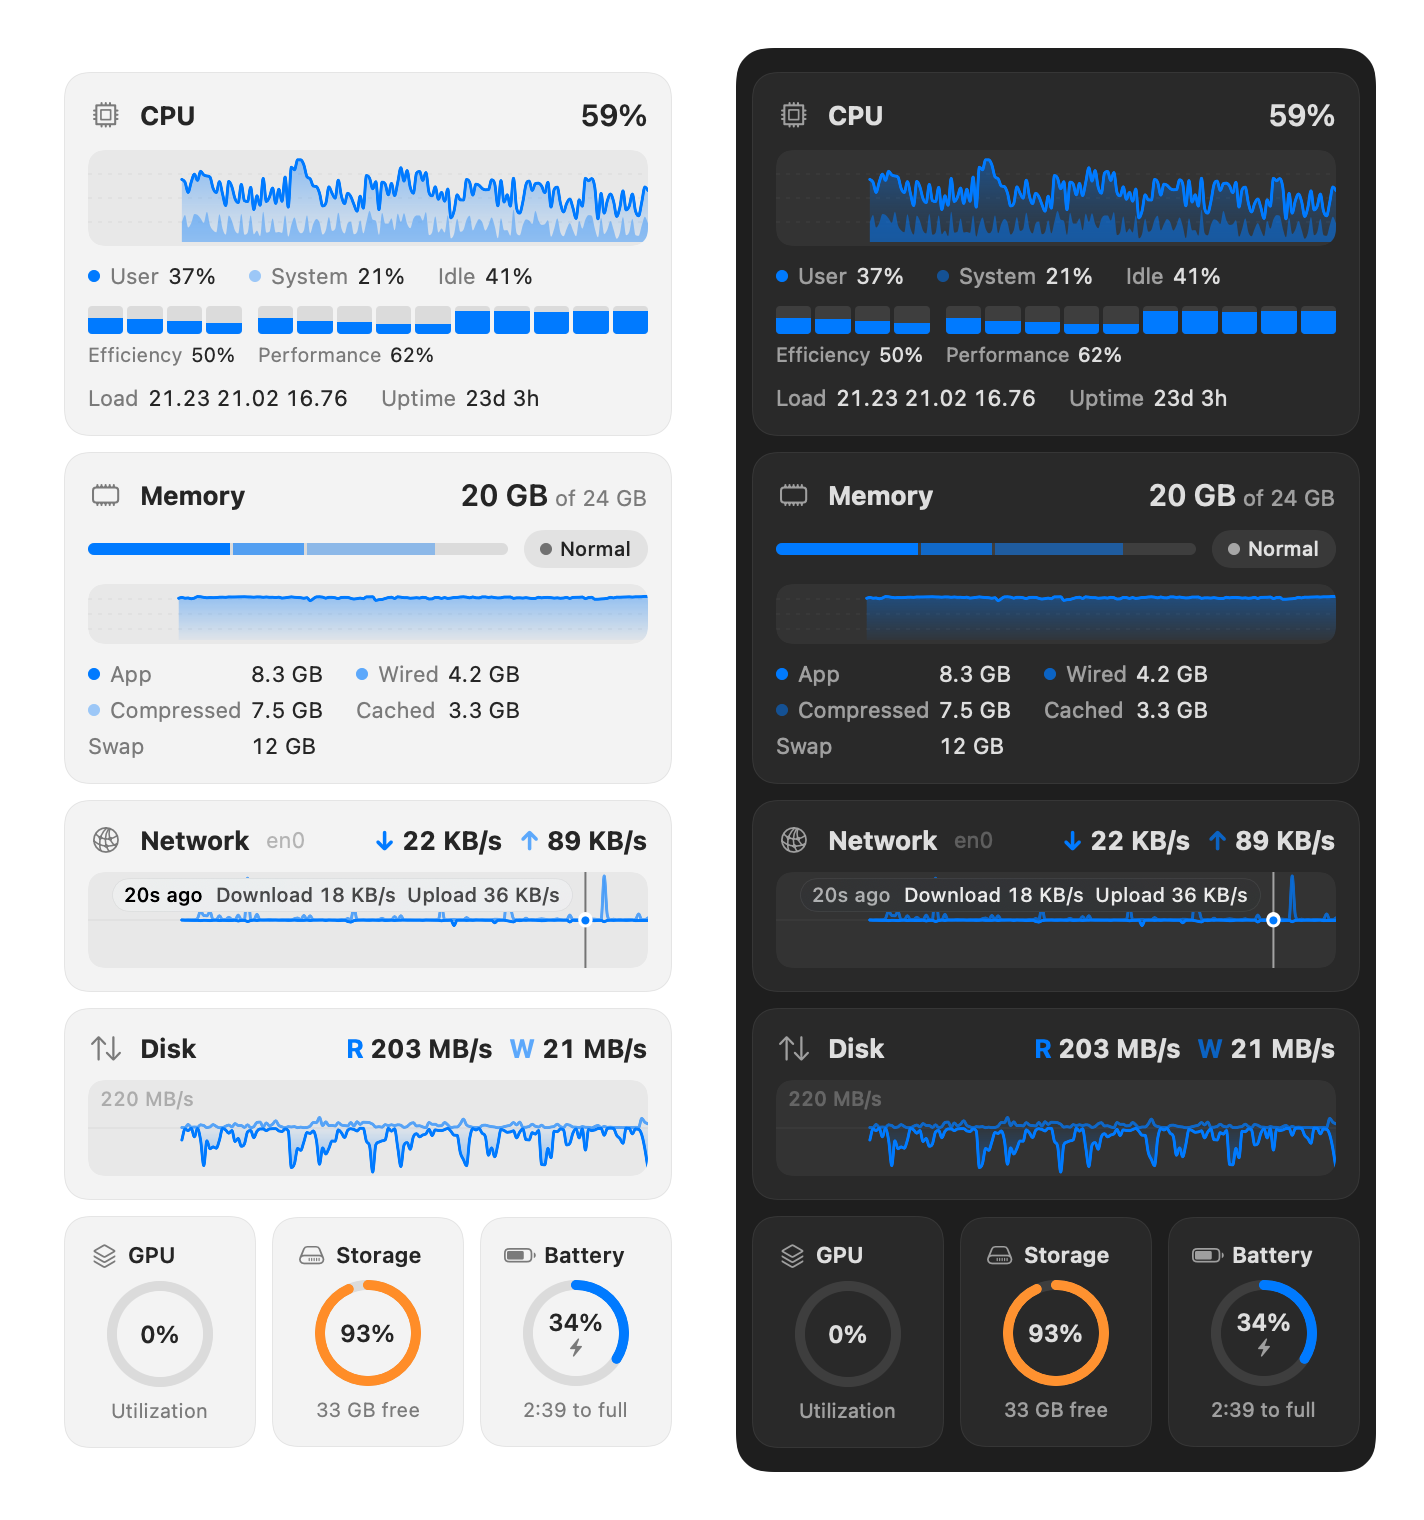
- CPU: user and system time, per-core load grouped into efficiency and performance clusters, load average, and uptime.
- Memory: Activity Monitor's breakdown (App, Wired, Compressed, Cached, Swap) with a pressure indicator.
- Network and Disk: per-interface and per-disk rates.
- GPU, Storage, and Battery: rings with utilisation, free space, and time to full or empty.
Hover any graph to read back a past value. Graphs, gauges, and legends use the colour chosen in Settings; only a warning or a critical state shows its own orange or red. ⌘, opens Settings and ⌘Q quits, as in any menu.
Settings
Choose Settings… from the menu, press ⌘, while it's open, or open Common Stats again from Finder or Spotlight. A live preview of the bar sits at the top.
Items
Each metric gets a style: Value, Graph, Graph and Value, Gauge, Gauge and Value, or Don't Show. Network and disk offer value and graph styles; storage and battery offer value and gauge styles. Drag rows to reorder, or use Move Up and Move Down from the context menu or VoiceOver actions.
Appearance
Show labels turns the small CPU / MEM captions on or off. Density is Compact, Regular, or Spacious. Color is your accent colour, a colour per metric, or one of eight system colours, for the menu's graphs, gauges, and legends; beneath the swatches, a bar shows the shades the menu will use. Color in menu bar carries it into the menu bar, which otherwise stays monochrome.
General
Open at login, and Update every 0.5, 1, 2, 3, or 5 seconds.
Common Tools
The other Common Tools apps, to open or get, and the version of Common Stats you're running.
Accuracy
Each figure comes from the same kernel source Apple's own tools use, and the tests compare them against those tools.
| Metric | Source |
|---|---|
| CPU | host_processor_info tick deltas, wraparound-safe. Clusters from the device
tree's cluster-type. |
| Memory | host_statistics64. App (anonymous − purgeable) + Wired + Compressed, checked
against vm_stat. |
| Network | NET_RT_IFLIST2 64-bit counters, primary interface only. Checked against netstat. |
| Disk activity | IOBlockStorageDriver statistics, per disk. |
| GPU | IOAccelerator performance statistics. |
| Storage | volumeAvailableCapacityForImportantUsage, the figure Finder shows. |
| Battery | IOKit power sources. Time remaining only once macOS has an estimate. |
Rates divide by the time that actually passed, on a clock that keeps counting through sleep. A gap longer than 10 seconds restarts the baseline, so a burst isn't averaged over time nobody saw. A value Common Stats can't read shows as a dash, never as a made-up zero.
Performance
On an M4 Pro, sampling all seven metrics takes about 0.1 ms and drawing the bar about 0.3 ms. The process uses about 0.5% of one core and 12 MB of memory.
- Drawing stops while the item can't be seen: behind the notch, collapsed, or under a full-screen app. Sampling continues, so graphs have no gaps.
- In Low Power Mode it samples half as often, and sampling stops while the displays sleep.
Questions
The item doesn't appear.
It may be behind the camera housing or hidden by a menu bar manager such as Common Bar. Open Common Stats again from Finder or Spotlight: that opens Settings, which says so while the item is hidden. Show fewer items, choose Compact density, or hold ⌘ and drag other items out of the way.
Why no temperatures or fans?
Apple silicon has no public API for them. The private sensor interfaces change between releases, and a figure that is silently wrong is worse than none.
Why no list of top processes?
Without root, macOS hides usage for about a fifth of processes, often the busiest ones. Use Open Activity Monitor in the menu.
Does it use the network?
No. No network access, no analytics, no helper tools, no root.
Build from source
The Command Line Tools are enough; Xcode is not required.
git clone https://github.com/oddurs/common-tools
cd common-tools
scripts/task build stats      # build for this Mac → build/stats/Common Stats.app
		>